


Assessment
To assess the behaviour of the skin, it is also important to consider the change from the deformed state to the normal state.This is carried out through a combination of the elevation and retraction phase, and the parameter thus defined is referred to as viscoelasticity. According to Cortex Technology, an effective treatment would result in a higher viscoelasticity value.
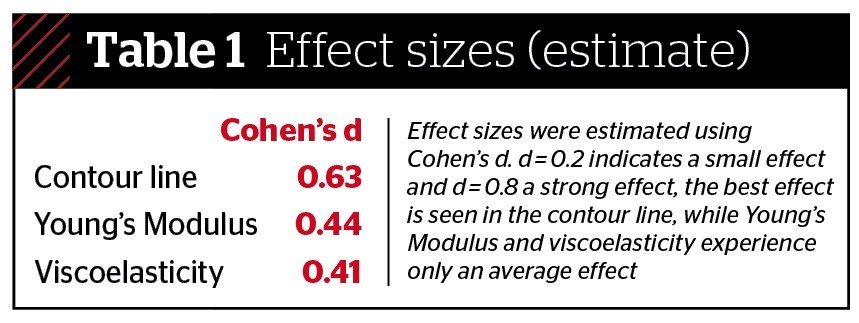
Statistical analyses were performed using the SigmaStat 3.5 software (www.systat.com). As the number of patients was rather small, median values are used and the 25% and 75% quartiles are given in brackets. Non-parametric tests were used throughout the entire analysis process. For the estimation of effect sizes, Cohen’s d mean and standard deviations were used.
Results
This clinical evaluation included 15 female patients. The average age was 35 years (29; 50). The average body mass index (BMI) was 22.3 (20.9; 25.9) at the start of the study, and showed a slight increase to 22.4 after the treatment period, and to 22.5 at the follow-up visit.
The average circumference of both the left and right thigh decreased from 55.8 cm (51.8; 57.8) at baseline to 54.8 cm (50.8; 56.8) after the treatment period and to 53.1 cm (50.6; 56.5) at the follow-up visit.
The degree of cellulite, determined by the aesthetic practitioner on the basis of the CSS, showed a significant decrease from 9 (6; 11) at baseline to 8.5 (6; 10) after the treatment period, and to 7 (4.3; 8) at follow-up (Figure 2). The photographic documentation was evaluated by four different experts using the modified Hexsel Scale (CSS).
The ratings of the four experts and the therapist at baseline were compared in order to see whether they coincide in their estimation of cellulite. This comparison is done using Kendall’s coefficient of concordance (Kendall’s W). It is 1 for a total overlap of the results, 0 for total disagreement and 1/m for random agreement, m being the number 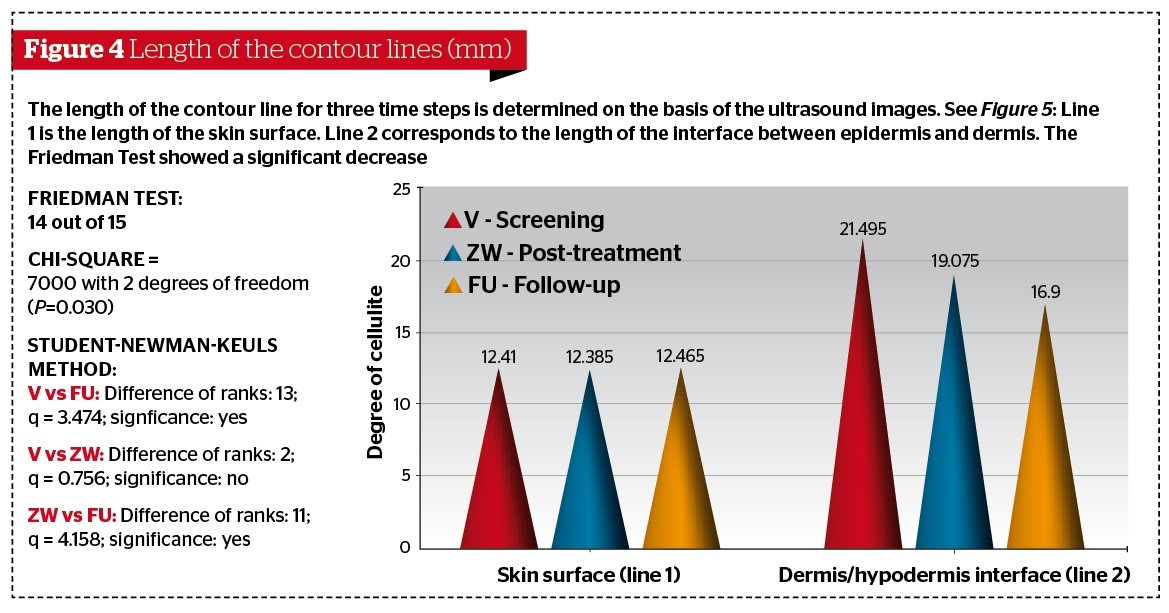 of evaluators. The overall W for all patients at baseline was 0.833, which indicates a high correspondence. With m = 5 (four experts plus the aesthetic practitioner) and the degree of freedom df = 14, one can calculate a highly significant difference between the results of the evaluators and a random concordance.
In the evaluation of the DermaScan data, only 14 out of 15 patients were considered, as the baseline values of one patient were missing. As seen in Figure 4, the contour line of the skin surface (line 1) remained constant over the entire case report. The contour line of the back of the thighs (line 2) decreased from the baseline value of 21.495 mm (17.19; 24.24) to 19.075 mm (18.28; 24.84) after the treatment, and to 16.9 mm (15.81; 19.33) at the follow-up measurement. The Friedman test as a test for repeated
measures analysis of variance on ranks showed a statistically significant difference (P=0.03). The Student-Newman–Keuls Method identified differences between baseline and FU, and ZW and FU. The skin thickness measurement showed no significant change over the entire case report: baseline 1.7 mm (1.49; 1.91); ZW 1.72 mm (1.51; 1.87); and FU 1.68 mm (1.41; 1.79).
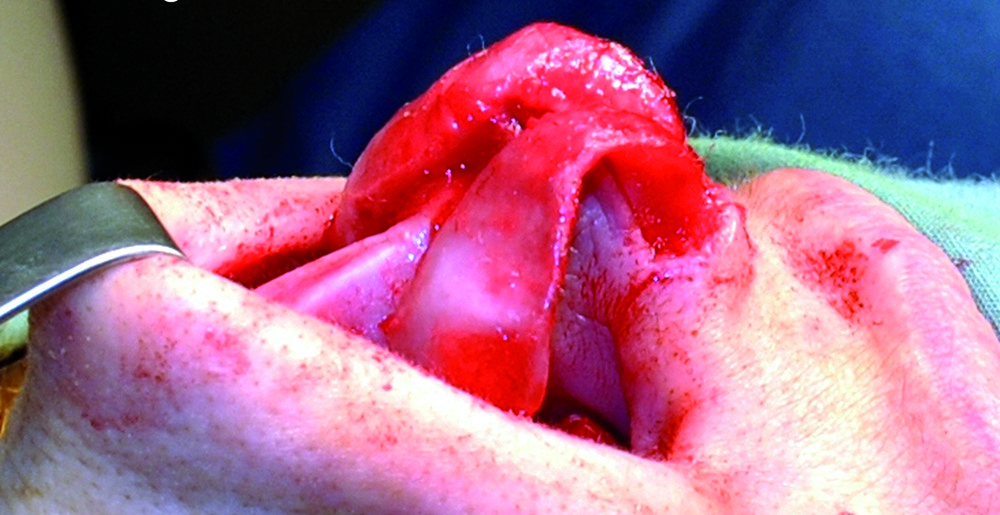
Figure 5 High resolution ultrasound images with a height of 12.1 mm and a penetration depth of a few cm of the skin obtained at the front side of the right thigh. (A) Image at baseline. The long contour line resulting from the dark notches that penetrate into the epidermis is clearly visible. This is a manifestation of cellulite. (B) The dark notches are drastically reduced at the follow-up visit
In the data received using the DermaLab measure, one baseline data set was missing (14 out of 15). The raw data for Young’s Modulus were corrected using the skin thickness achieved from the DermaScan measure. For two patients, post-treatment values were missing and were replaced with the last value carried forward method.
Young’s Modulus data showed an upward trend; however, they scatter strongly and there is no significant change. Baseline: 1.28 MPa (0.85; 2.02), ZW: 1.51 MPa (1.20; 1.85), FU: 1.93 MPa (1.57; 3.05). The viscoelasticity increased from 0.61 MPa to 0.99 MPa, showing that the skin was tighter and stronger.